Featured Photo: Nick Trehearne
The Quality Deer Management Association (QDMA) recently released its 2018 Whitetail Report. This is the group’s 10th release of such a report. This edition covers deer harvest trends through the 2016-17 season, the most recent hunting season with data from most whitetail states and Canadian provinces.
The report is 68 pages so there’s a ton of data and trend highlights. For now, here’s a look at information that stood out at first glance. Grand View Outdoors will provide additional coverage in the coming weeks, taking deeper looks at trends we believe will be of the most interest to our readers.
Top 5 States: Antlered Buck Harvest
| State | 2016 Harvest |
| Texas | 399,487 |
| Michigan | 196,233 |
| Wisconsin | 156,920 |
| Pennsylvania | 149,460 |
| Georgia | 134,456 |
Top 5 States: With Highest Percentage of 3 1/2 -Plus Bucks in Buck Harvest
| State | 2016 Percentage |
| Mississippi | 78 |
| Arkansas | 77 |
| Louisiana | 72 |
| Oklahoma | 59 |
| Texas | 59 |
Antlerless harvest
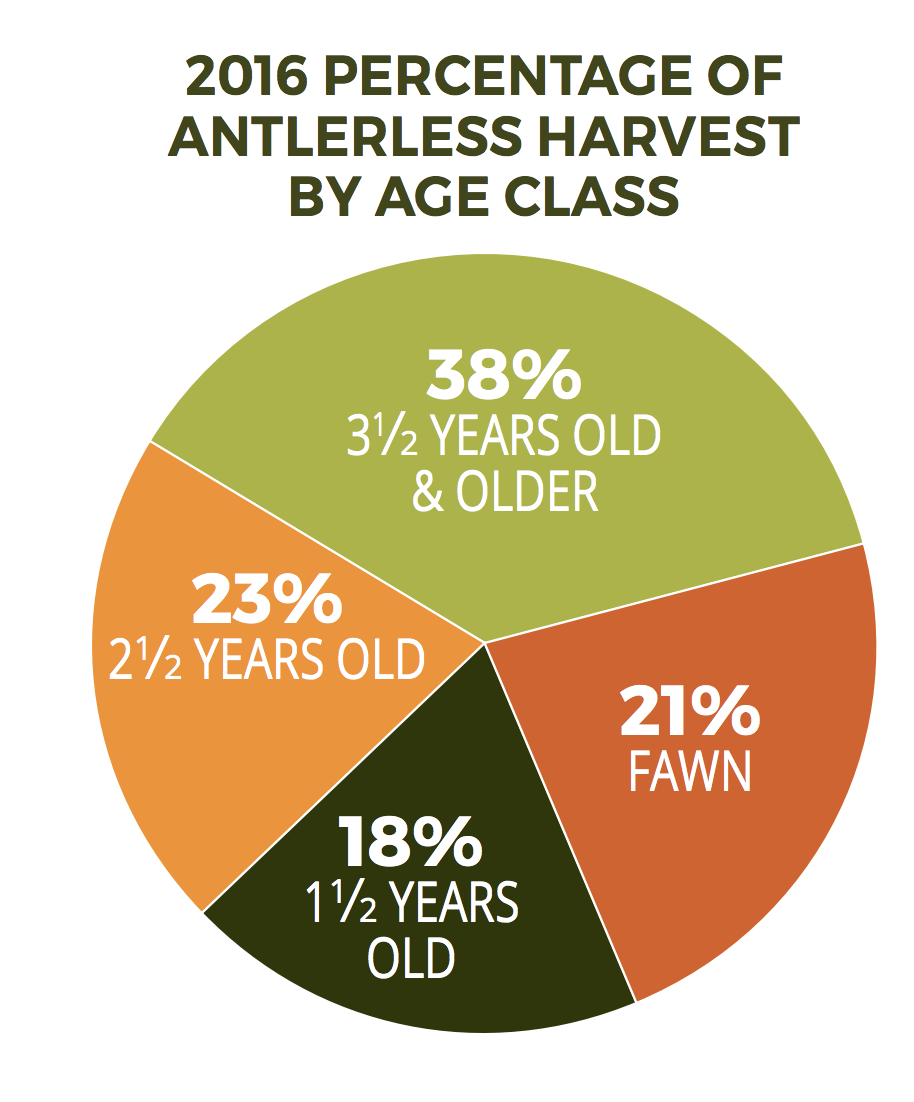
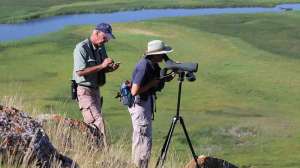
Monitoring the age structure of the harvest is key for deer managers to make wise management decisions including the appropriate number of antlerless deer to harvest annually. Photo: QDMA Whitetail Report
Top States: Percentage harvest by bow
| State | 2016 Percentage |
| New Jersey | 58 |
| Connecticut | 50 |
| Ohio | 45 |
| Massachusetts | 42 |
| Illinois | 37 |
| Kansas | 37 |
| Michigan | 37 |
Top States: Percentage of harvest by rifle/shotgun
| State | 2016 Percentage |
| Idaho | 94 |
| Wyoming | 93 |
| Montana | 92 |
| Texas | 91 |
| Maine | 89 |
| South Carolina | 89 |
Top States: Percentage of Harvest by Muzzleloader
| State | 2016 Percentage |
| Road Island | 45 |
| Virginia | 27 |
| New Hampshire | 23 |
| Tennessee | 23 |
| Massachusetts | 22 |
| Vermont | 22 |
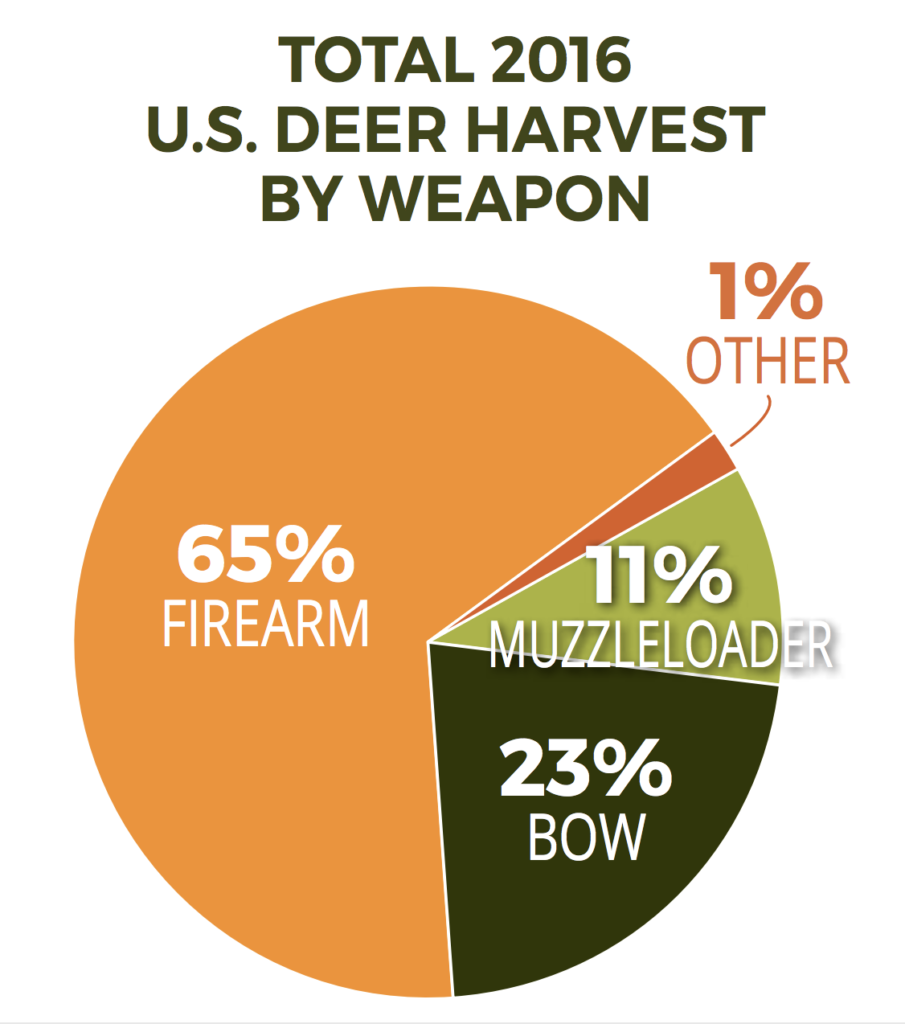
Photo: QDMA Whitetail Report
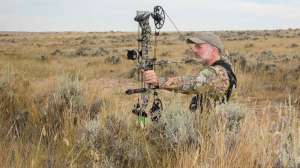
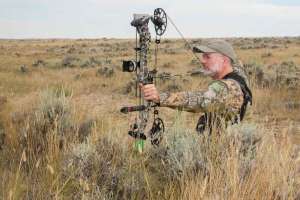
What was learned about crossbow use among deer hunters?
Six years ago, crossbows could be legally used to hunt whitetails in 21 of 37 states (57 percent) in the Midwest, Northeast and Southeast for at least a portion of archery season, according to the QDMA report. Today, that number has increased to 29 of 37 states (78 percent).
Within the hunting community, crossbows can be a divisive issue. QDMA’s position statement on crossbows was included in the report and here’s where the group stands:
"The QDMA is dedicated to ensuring the future of white-tailed deer, wildlife habitat and our hunting heritage. As such, we are more interested in managing deer and habitat appropriately and protecting our hunting heritage than debating use of specific weapons. If the use of crossbows positively impacts a deer management program and helps recruit and retain more hunters, then we fully support it."
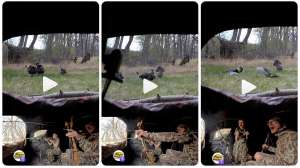
U.S. hunter numbers and spending behaviors
Hunter spending is down, according to the U.S. Fish and Wildlife service as reported by QDMA. In 2016, hunters spent $25.6 billion on hunting. Most of this spending went toward equipment and only 3 percent was spent on hunting licenses and fees. Conversely, the country has lost 2.2 million hunters in the last five years. That’s a 16 percent decline from 2011 to 2016.
So how does the decline in hunter numbers impact expenditures? It’s down by $11 billion dollars or 30 percent. Even worse, the number of hunters is expected to decline further as Baby Boomers exit the sport.
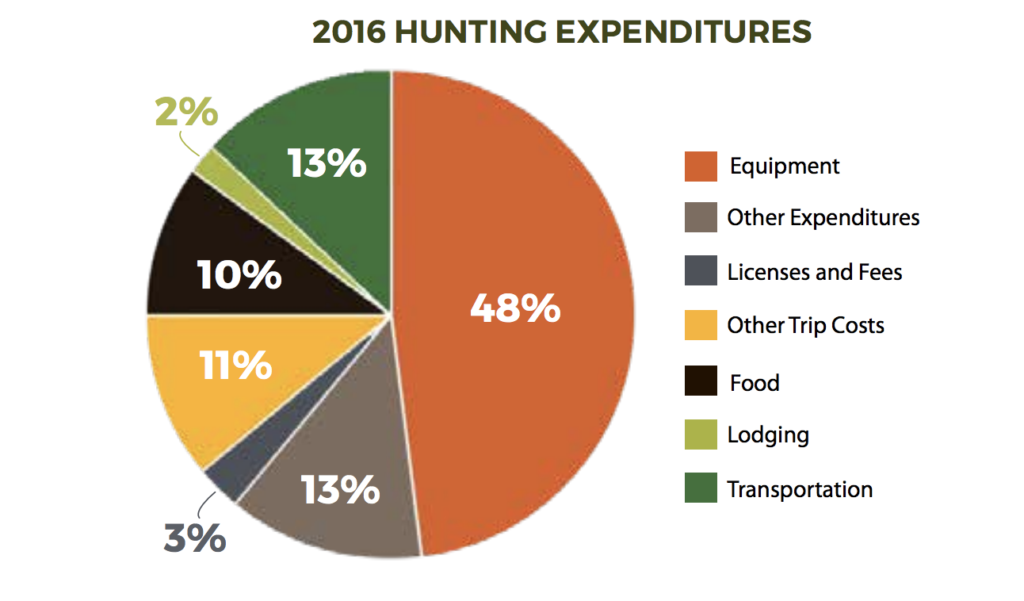
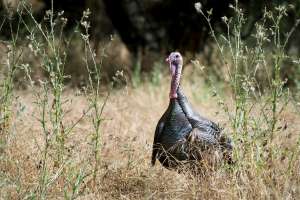
Photo: QDMA Whitetail Report
After whitetail deer, wild turkey is the next most hunted species. but there’s a huge gap between first and second place: deer hunters outnumber turkey hunters nearly four to one. So as deer and deer hunters go, so too goes hunting and its funding of wildlife conservation.
Top 5 States: With the highest number of deer hunters
| States | 2016 Number |
| Texas | 738,713 |
| Pennsylvania | 700,000 |
| Wisconsin | 642,517 |
| Minnesota | 600,000 |
| Michigan | 586,000 |
Top 5 States: With the largest increase in deer hunter numbers in the last 10 years
| States | 2016 Number |
| Tennessee | +35 |
| Texas | +28 |
| Georgia | +21 |
| Idaho | +17 |
| Oklahoma | +16 |
We’ll leave you with these report highlights for now. There’s a ton of context and substance in the report itself and you can download the entire document here at no cost.
More installments and analysis of QDMA’s findings will be posted to Grand View Outdoors in the coming weeks. So check back for the latest here.